Monitoring
Infragate offers basic observability features so you can see how your MCP server and tools behave in near-real-time. This page covers how to interact with these features
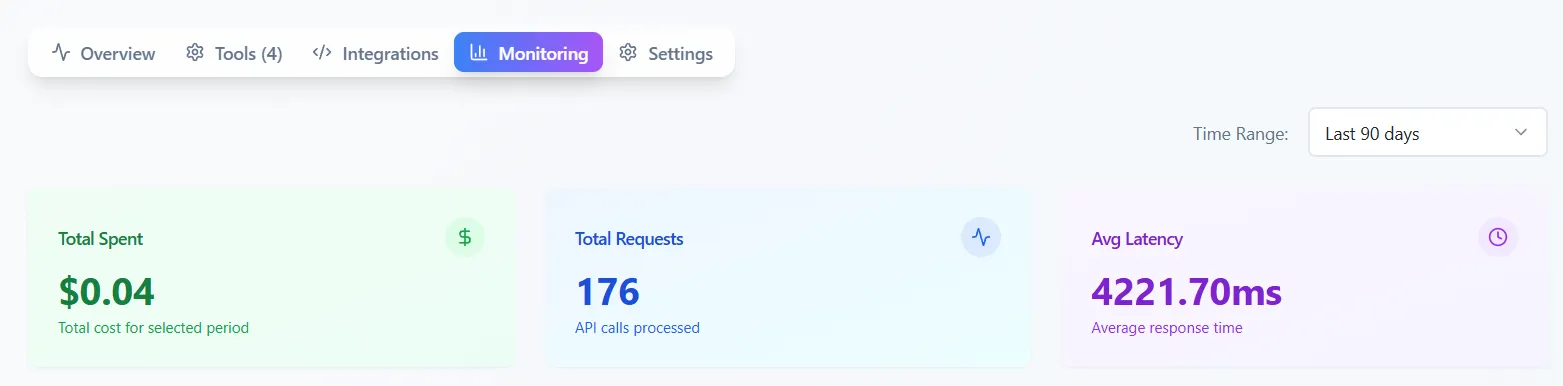
What you get out of the box
Section titled “What you get out of the box”- Gateway metrics: request volume, latency, billing usage
- Structured logs: structured logs - with retention of 14 days
The homepage of the monitoring displays the last 20 log messages. To view more, click the “View All Logs” button.
Each log entry contains the following attributes:
- Tool name
- Data Source
- Request ID
- The log message
- Timestamp
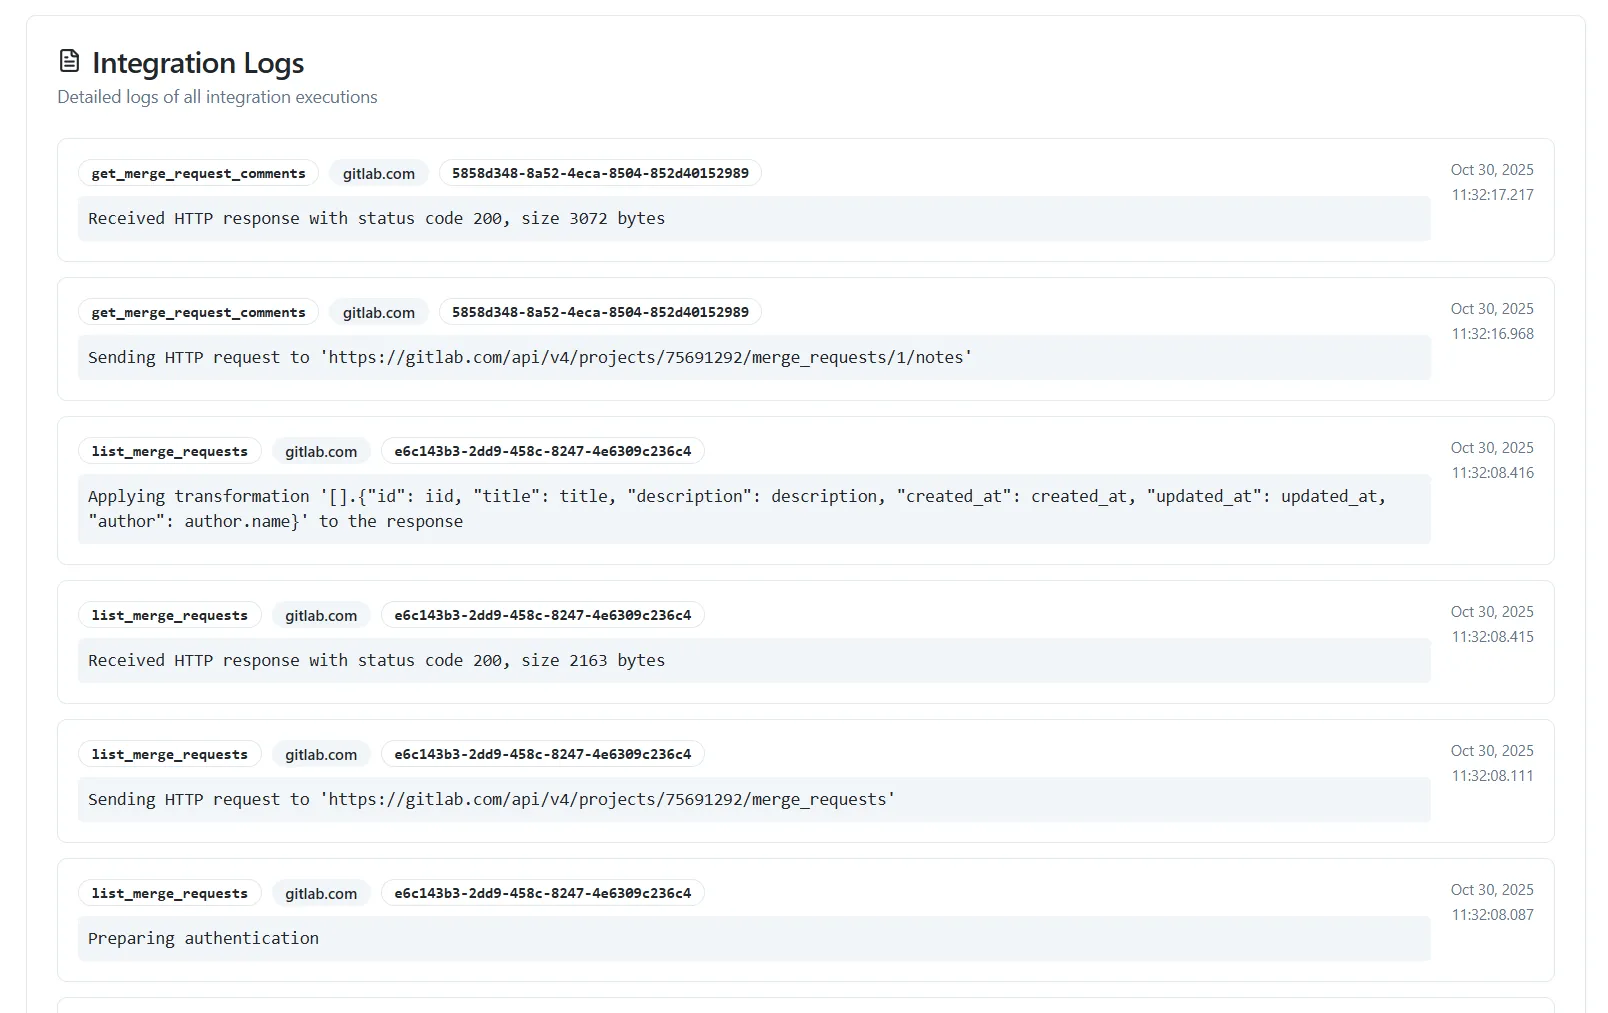
In the above example we can see several log messages from a custom Gitlab MCP server.
The last log reveals that the tool that was used was get_merge_request_comments which accessed the data source called gitlab.com.
The request ID was 5858d348-8a52-4eca-8504-852d40152989 and the timestamp is at Oct 30, 2025 11:32:17 (UTC).